
Among the many mapping tools available, the most commonly used is the topographic map. Topography is defined as the relief (relative elevations) of a surface and the relative relations between its natural and man-made features. Topographic maps systematically portray the spatial relationship among both the physical features, such as contour lines (lines of equal elevation) and hydrographic symbols, and cultural features, such as roads and administrative boundaries. Topographic maps are also known as “topo maps.”
Reading a topographic map begins with understanding the extent of reduction necessary to represent a given area of the Earth’s surface. This reduction is known as scale and is defined as a representation of the size of something on a drawing, photo, or map relative to the size of the real thing.
The U.S. Geological Survey (USGS) has been responsible for creating topographic maps of the United States since its inception in 1879. These maps come in a variety of scales. The most common for natural resource management purposes is the 1:24,000 series (where 1 map inch = 24,000 Earth inches or 2,000 feet). Maps at this scale cover an area measuring 7.5 minutes of latitude and 7.5 minutes of longitude and are commonly called 7.5-minute quadrangle maps, also known as “quads” or “quad sheets.” These mapping sheets represent 64 square miles in southern U.S. latitudes and 49 square miles in northern latitudes; thus, it takes about 57,000 7.5-minute quad sheets to cover the entire United States and its territories. These maps are used for local area planning, engineering, and recreation purposes. Maps at 1:50,000 to 1:100,000 show less detail but cover areas large enough for landscape management support. USGS also has smaller scale maps at 1:250,000, 1:500,000, and 1:1,000,000, which cover very large areas on the sheet and are used for regional and statewide planning. The USGS has an excellent webpage with graphic depictions of map scale.
The content of topographic maps may seem bewildering upon first glance; however, there is a method behind all the colored points, lines, and areas distinguishing key features. The smaller features of limited extent (such as the location of houses) are often represented by points, whereas much larger features (such as the outline of a large building) may be depicted as areas. In the mapping world, these areas are often known as polygons.
Colors that catch the eye first when looking at most 7.5-minute quadrangles are these:
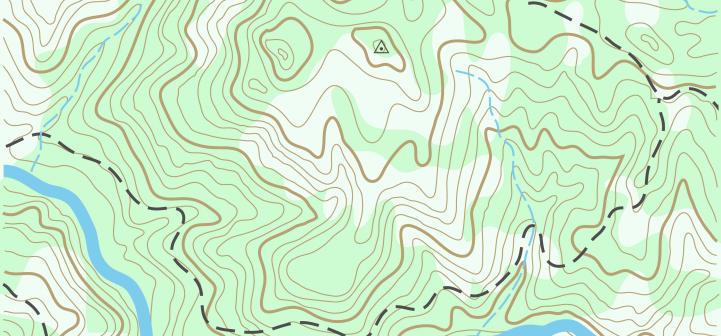
- green (vegetation)
- blue (water)
- gray or red (densely built-up areas)
- purple (information updated with aerial photography but not field verified)
Unique combinations of line style and color indicate similar features:
- brown for contour lines (which will be discussed in the next paragraph)
- blue for lakes, streams, irrigation ditches, etc.
- red for land grids and important roads
- black for other roads and trails, railroads, boundaries, etc.
- purple for updated features
A series of standardized symbols are used to depict features such as springs, water tanks, wells, mines, buildings, campgrounds, and survey control points.
The brown contour lines on topographic maps show elevation. Each contour line joins points of equal elevation above a specified reference, such as sea level. A contour line represents one and only one elevation and thus never splits or intersects other contour lines (expect in the rare case of an overhanging cliff). Note that the vertical distance between contour lines (the contour interval) is always equal; the smaller the contour interval, the higher (or more detailed) the vertical resolution, or the minimum separation of objects, of the map.
The horizontal distance between contours, on the other hand, is determined by the steepness of the landscape and can vary greatly depending on the terrain. The closer the lines are together, the steeper the object. USGS cartographers select a contour interval that will best show the shape of the terrain for each individual quad sheet. A flat area in Iowa might need a contour interval of 10 feet to capture some sense of relief. By contrast, a mountainous region of Arizona may have contour intervals of 100 feet or more; any finer would result in contours too tightly packed together to distinguish.
Concentric circles of contour lines indicate a hilltop or mountain peak, whereas concentric circles of hatched contour lines indicate a closed depression. Contour lines form a V pattern crossing streams with the V pointing upstream. Rounded contour lines generally denote hills or ridges.