Building a Web-Based Forest Management Enterprise Information System with ESRI’s ArcGIS Server

By Mindia Brown, Virginia Department of Forestry

Local and state government entities are moving more of their products and applications to the Web to facilitate improved public access to information as well as to encourage more efficient data collection and analysis capabilities to support the day-to-day mandates of government entities. This article summarizes how the Virginia Department of Forestry is using ArcGIS server to support data collection from local foresters.

There are more than 15 million acres of forest land …
The Role of GIS in the National Gypsy Moth Slow the Spread Project (STS)

The gypsy moth is a serious invasive pest of hardwoods. A native of Europe and Asia, the insect was accidentally released in the United States more than 130 years ago near Boston, Massachusetts, and has now spread into the mid-Atlantic and midwestern states. Populations are cyclical, with periods of low abundance and periods of outbreaks. Since the first reported defoliation in Virginia in 1984, more than 5.3 million acres have been defoliated in the state, with treatment costs alone over …

Using the Find, Go To X,Y and Measure Tools in ArcView 9 – ArcMap

Using the Find, Go To X,Y and Measure Tools in ArcView 9x

1. Select the Measure tool.

image description


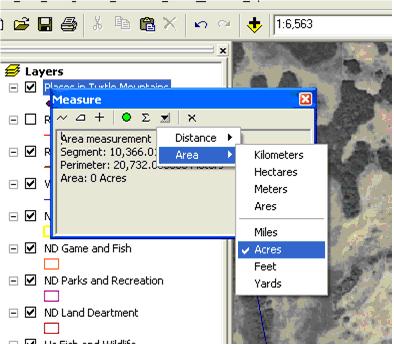
2. Choose the “Measure an Area” feature to determine the area of an irregular area. Use the left mouse to locate a start area and then continue to click at points around an area.

image description


Double-click to close the area. Set the area units to “Acres.”

3. Select the “Go To X,Y” tool

image description


4. Enter a desired longitude and latitude in the “Go To …

Introduction to GIS Using ArcView 9 – ArcMap

Introduction to GIS Using ArcView 9 – ArcMap

1.Start ArcMap. The “Start using ArcMap” window will display. Click “OK.”

image description


2.The Data View window will be displayed without layers.

3.Provide descriptive information to this GIS map as follows:

a) From the File pull-down menu choose “Map properties”.
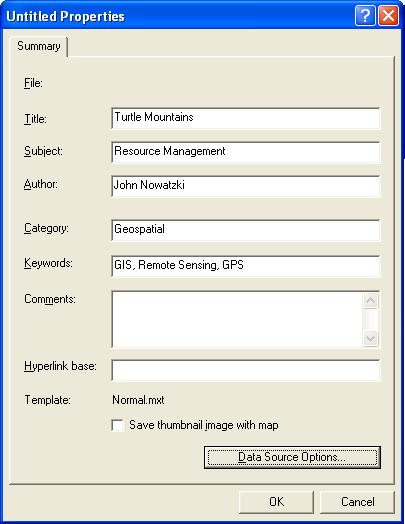
b) Add a title, subject, author, and keywords.

image description


4. Set the Data Source Options to “Store relative path names to data sources.”(This choice facilitates transferring ArcVeiw projects …

MODIS: Satellite Sensor

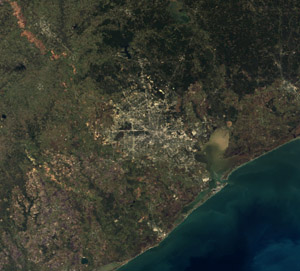
A visible color composite (bands 1-Red, 4-Green, and 3-Blue) of a Terra MODIS acquisition on Nov. 17, 2006. This subset is centered on the city of Houston, Texas. Sediment-laden water is visible in Trinity Bay and Galveston Bay, southeast of Houston. In the northwest corner of the image subset, farmland along the Brazos River and urban lands in the cities of Bryan and College Station, Texas, are easily identified.

Description
The MODIS (Moderate-Resolution Imaging Spectroradiometer) instruments are part of the …